Weights, Design, and Estimands: A Field Guide for Applied Researchers
An online book
You have the public-use file open. The referee report is due, or the second-year paper is, and the questions that stop you are not in the econometrics sequence. Should I use the weights, and which column is the weight? Why does my replication of a Census number come out different? My advisor says cluster by state and the referee says by county; who is right, and how would I know? Is the standard error the software printed the standard error of anything?
This book answers those questions with the surveys you actually use and numbers you can check. In one release the Census Bureau reported that 5.2%5.2%EstimandShare of children under 18 in SPM units whose resources after taxes, transfers, and necessary expenses are below the SPM threshold (SPMPOV = 1), income year 202195% CI4.8%–5.6% (t, df = 159)n38,574WeightASECWTVarianceSuccessive-difference replication, 160 replicate weightsSourceIPUMS CPS ASEC 2022 (analysis/cps/cps_asec/part_2020_2025.parquet; replicate weights analysis/cps/cps_asec_repwt/part_2020_2025.parquet)External benchmarkCensus Bureau published 5.2% (external benchmark) of American children were poor and that 15.3%15.3%EstimandShare of children under 18 in families whose pre-tax money income is below the official poverty threshold (IPUMS POVERTY = 10, 'Below poverty'), income year 202195% CI14.6%–16.0% (t, df = 159)n38,278WeightASECWTVarianceSuccessive-difference replication, 160 replicate weightsSourceIPUMS CPS ASEC 2022 (analysis/cps/cps_asec/part_2020_2025.parquet; replicate weights analysis/cps/cps_asec_repwt/part_2020_2025.parquet)External benchmarkCensus Bureau published 15.3% (external benchmark) were. A Medicaid-expansion regression on the American Community Survey has a standard error 6.1×6.1× ratioEstimandRatio of the state-clustered (CRV1) standard error to the HC1 standard errorWeightPERWTVarianceNone reportedSourceIPUMS USA, ACS 1-year samples 2011–2019 (analysis/usa/acs/part_2010_2014.parquet, part_2015_2019.parquet); expansion dates in _data/expansion_dates.csv (KFF; medicaid.gov) as large once the question is which states decided, not how many people were interviewed. A ranking of state uninsured rates looks definitive, and the survey's own replicate weights can tell apart 22 countEstimandOf the 50 pairs adjacent in the ranking, the number distinguishable at the 90% level with SDR SEs of the difference.WeightPERWTVarianceSuccessive-difference replication, 80 replicate weightsSourceIPUMS USA, ACS 2024 1-year sample (analysis/usa/acs + acs_repwt, part_2020_2024.parquet; PERWT and REPWTP1-80) of its 50 neighbouring pairs. None of these is a mistake. Each is a weighted number answering a question nobody wrote down: who it describes, how each observation counts, and what could have come out differently.
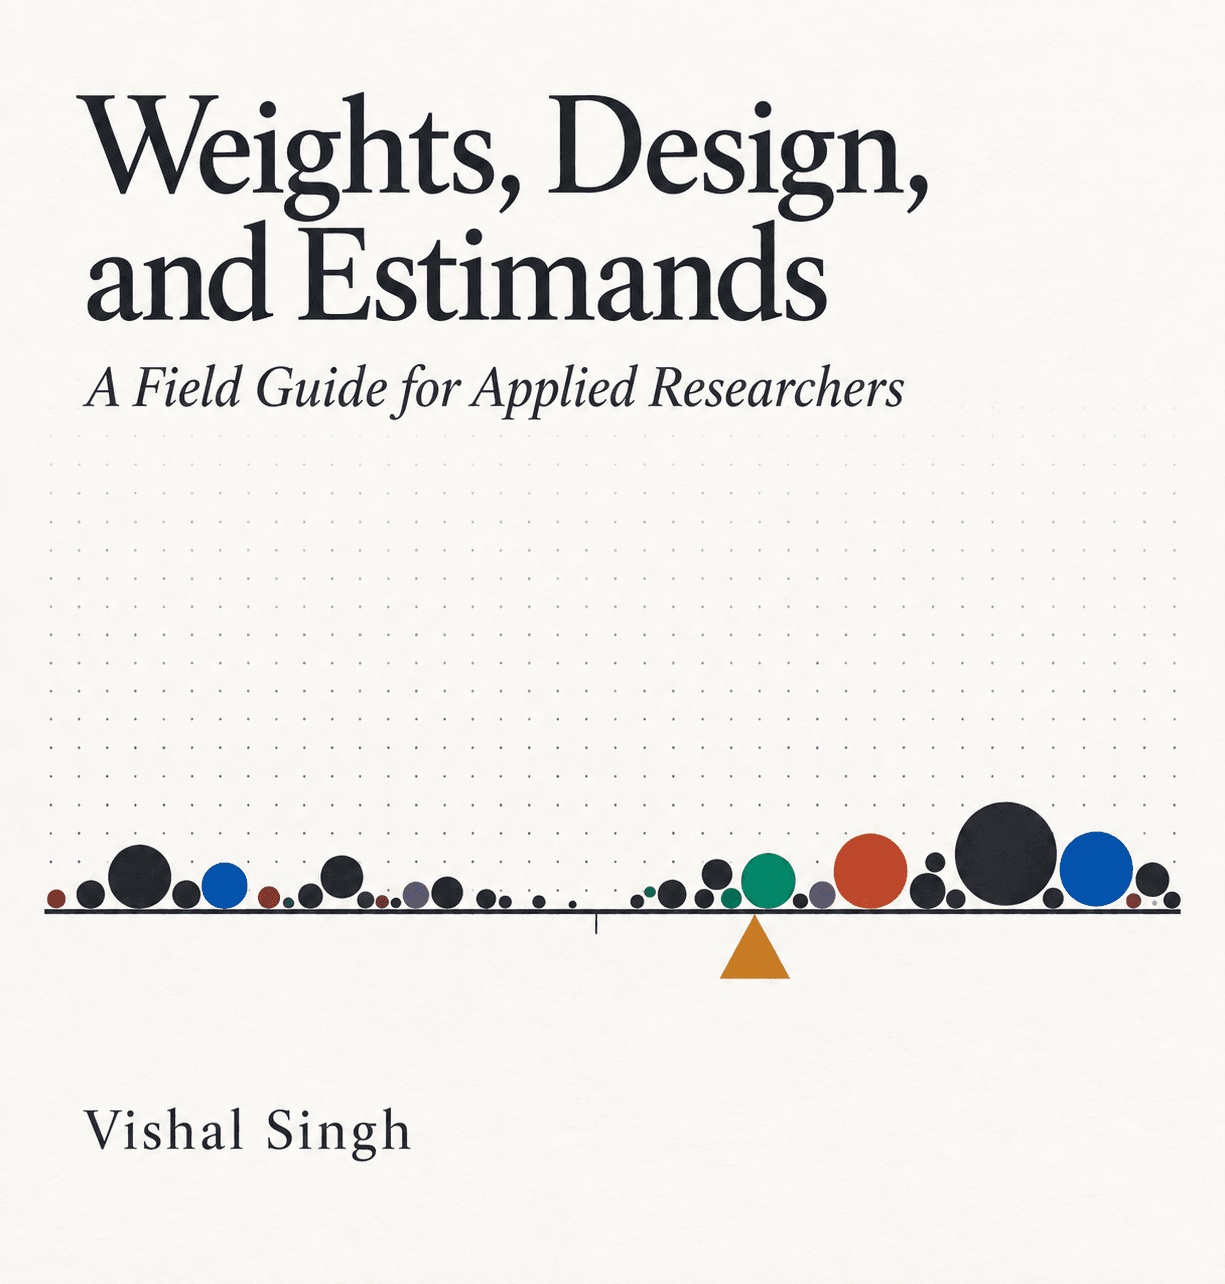
The cover shows a beam balanced on a pivot set to one side. Move the pivot and the same circles tip the other way. A survey weight, a regression's hidden weight, a choice of cluster: each one moves the pivot. Every chapter starts from a real study or a published number, works the question by hand before any software, and ends by saying what the analysis does not establish. The examples come from political science, labor and health economics, and public health, because that is where the questions come from.
- 5.2%5.2%EstimandShare of children under 18 in SPM units whose resources after taxes, transfers, and necessary expenses are below the SPM threshold (SPMPOV = 1), income year 202195% CI4.8%–5.6% (t, df = 159)n38,574WeightASECWTVarianceSuccessive-difference replication, 160 replicate weightsSourceIPUMS CPS ASEC 2022 (analysis/cps/cps_asec/part_2020_2025.parquet; replicate weights analysis/cps/cps_asec_repwt/part_2020_2025.parquet)External benchmarkCensus Bureau published 5.2% (external benchmark) and 15.3%15.3%EstimandShare of children under 18 in families whose pre-tax money income is below the official poverty threshold (IPUMS POVERTY = 10, 'Below poverty'), income year 202195% CI14.6%–16.0% (t, df = 159)n38,278WeightASECWTVarianceSuccessive-difference replication, 160 replicate weightsSourceIPUMS CPS ASEC 2022 (analysis/cps/cps_asec/part_2020_2025.parquet; replicate weights analysis/cps/cps_asec_repwt/part_2020_2025.parquet)External benchmarkCensus Bureau published 15.3% (external benchmark)Two child poverty rates, one year, one survey. Chapter 1 asks what each one is a rate of.
- 6.1×6.1× ratioEstimandRatio of the state-clustered (CRV1) standard error to the HC1 standard errorWeightPERWTVarianceNone reportedSourceIPUMS USA, ACS 1-year samples 2011–2019 (analysis/usa/acs/part_2010_2014.parquet, part_2015_2019.parquet); expansion dates in _data/expansion_dates.csv (KFF; medicaid.gov)The standard error when thirty states, not a million records, are the units. Chapters 6 and 7 ask whose decision it was.
- 22 countEstimandOf the 50 pairs adjacent in the ranking, the number distinguishable at the 90% level with SDR SEs of the difference.WeightPERWTVarianceSuccessive-difference replication, 80 replicate weightsSourceIPUMS USA, ACS 2024 1-year sample (analysis/usa/acs + acs_repwt, part_2020_2024.parquet; PERWT and REPWTP1-80) of 50Neighbouring states a ranking can actually tell apart. Lab 3 lets the replicate weights speak.
What is this number a weighted average of, and who chose the weights?
Written for doctoral students and applied researchers in economics, political science, sociology, psychology, marketing, and public health who have taken an econometrics or statistics sequence but no course in survey sampling. The data are public surveys: the ACS, the CPS, the American Time Use Survey, NHANES, NHIS, and BRFSS, with code in Python, R, and Stata.